Code
# Don’t worry about understanding this code! It’s just here to embed the YouTube video into the webpage
from IPython.display import YouTubeVideo
YouTubeVideo("14VYnFhBKcY")| Name | Wesley Zheng |
| Pronouns | He/him/his |
| wzheng0302@berkeley.edu | |
| Discussion | Wednesdays, 12–2 PM @ Etcheverry 3105 |
| Office Hours | Tuesdays/Thursdays, 2–3 PM @ Warren Hall 101 |
Contact me by email at ease — I typically respond within a day or so!
An extremely important aspect of data science is visualizing the data in a precise, consistent manner.
A common discussion people have when visualizing data revolves around the scale of the y-axis on a chart. It is commonly believed that charts with numerical y-axis must always start at 0. After watching the video, do you think this is true? Discuss the following questions.
# Don’t worry about understanding this code! It’s just here to embed the YouTube video into the webpage
from IPython.display import YouTubeVideo
YouTubeVideo("14VYnFhBKcY")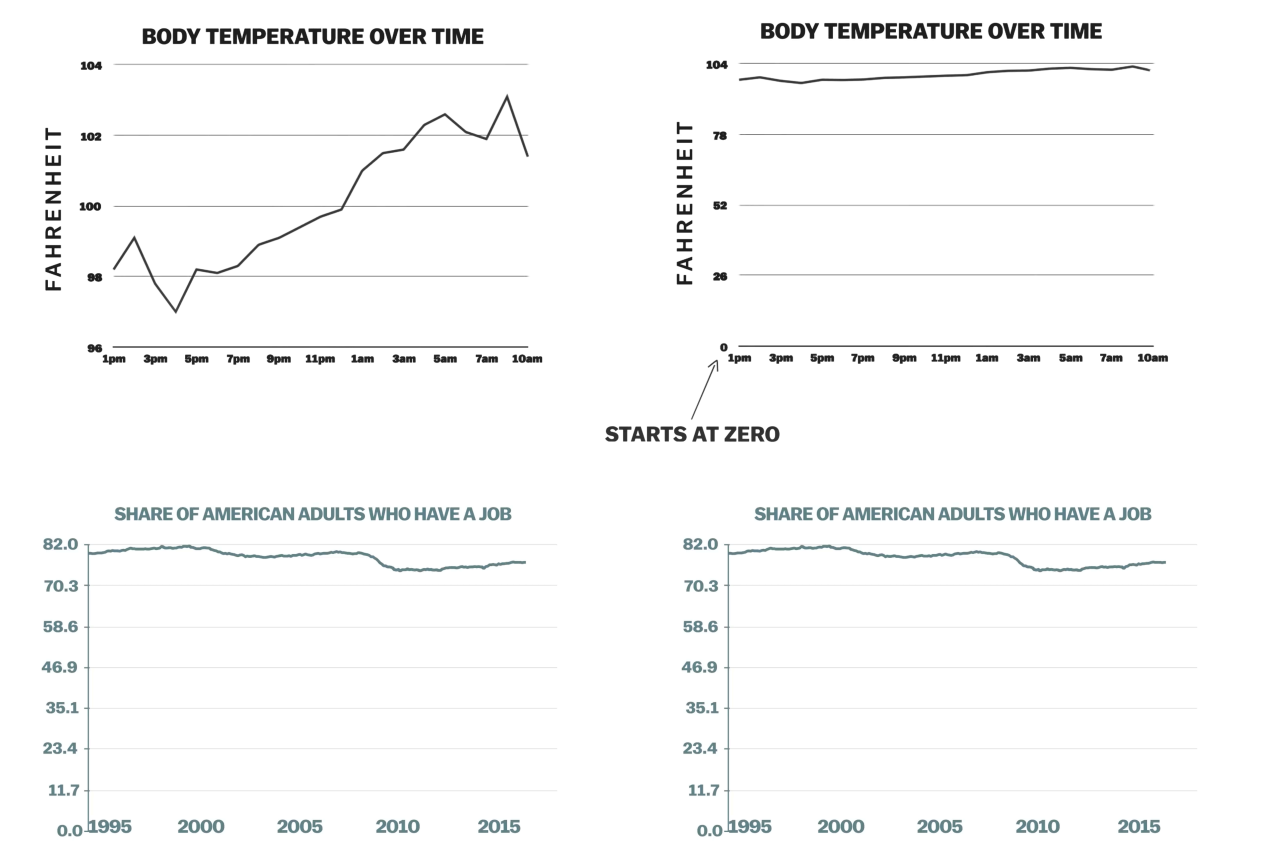
Think about different types of visualizations and their purposes:
We usually tell you what visualization to make, but now it’s important to also think about why we choose certain visualizations and what they communicate.
In your opinion, when is it appropriate to start the y-axis at 0, and when not?
In general, what should we consider when making a good data visualization?
Answers vary. We may want to first think about the purpose of the visualization — what are we trying to show? Is there a trend of interest? A relationship between multiple variables? These questions will guide us toward choosing not only an appropriate type of visualization but also the best ways in which we can present them.
An example: body temperature never needing to reach 0, as seen in the graphs above.Next, we’ll transition from discussing visualizations to working with tables in Python. Table methods allow us to:
This helps us connect how we make visualizations with why we choose them.
In tennis, a player hits an ace when their serve is untouched by the opponent. Your friend Tim is interested in analyzing the 8 male tennis professionals who have hit the most aces throughout tennis history. The table below is called tennis and includes statistics obtained from the ATP Tour. The table is sorted in decreasing order of Num. Aces, the total number of aces (as an integer) hit by that player in their career.
# Initializing the table!
from datascience import *

tennis = Table().with_columns(
    "Name", ["John Isner", "Ivo Karlovic", "Roger Federer", "Feliciano Lopez",
             "Goran Ivanisevic", "Andy Roddick", "Sam Querrey", "Pete Sampras"],
    "Nationality", ["United States", "Croatia", "Switzerland", "Spain",
                    "Croatia", "United States", "United States", "United States"],
    "Num. Aces", [14470, 13728, 11478, 10261, 10237, 9074, 8879, 8858],
    "Matches Played", [772, 694, 1462, 976, 731, 776, 694, 792],
    "Height (cm)", [208, 211, 185, 188, 193, 188, 198, 185],
    "Weight (kg)", [108, 104, 85, 88, 82, 88, 95, 77]
)

tennis| Name | Nationality | Num. Aces | Matches Played | Height (cm) | Weight (kg) |
|---|---|---|---|---|---|
| John Isner | United States | 14470 | 772 | 208 | 108 |
| Ivo Karlovic | Croatia | 13728 | 694 | 211 | 104 |
| Roger Federer | Switzerland | 11478 | 1462 | 185 | 85 |
| Feliciano Lopez | Spain | 10261 | 976 | 188 | 88 |
| Goran Ivanisevic | Croatia | 10237 | 731 | 193 | 82 |
| Andy Roddick | United States | 9074 | 776 | 188 | 88 |
| Sam Querrey | United States | 8879 | 694 | 198 | 95 |
| Pete Sampras | United States | 8858 | 792 | 185 | 77 |
Unfortunately, the code Tim wrote to analyze the data has some issues. Below are some error messages that appeared, along with what Tim was trying to calculate. Describe the issues and explain how you would change the code to fix them.
Error messages in Jupyter notebooks may look intimidating, but they are one of your best tools for learning.
Key Idea
Even unusual errors can usually be traced back to a small mistake.
The proportion of players in the table that are from the United States.
tennis.where("Nationality", "United States") / tennis.num_rows--------------------------------------------------------------------------- TypeError Traceback (most recent call last) Cell In[3], line 1 ----> 1 tennis.where("Nationality", "United States") / tennis.num_rows TypeError: unsupported operand type(s) for /: 'Table' and 'int'
The code results in an error because it tries to divide a table by an integer, which is not a valid operation.
Correct code:
tennis.where("Nationality", "United States").num_rows / tennis.num_rows0.5An array of the average number of aces hit per match for each player.
tennis.column("Num. Aces") / tennis.select("Matches Played")--------------------------------------------------------------------------- TypeError Traceback (most recent call last) Cell In[5], line 1 ----> 1 tennis.column("Num. Aces") / tennis.select("Matches Played") TypeError: ufunc 'divide' not supported for the input types, and the inputs could not be safely coerced to any supported types according to the casting rule ''safe''
The code results in an error because it attempts to divide an array by a table. Arrays can only be divided by an integer or another array of a similar data type and of the same length.
Correct code:
tennis.column("Num. Aces") / tennis.column("Matches Played")array([ 18.74352332, 19.78097983, 7.85088919, 10.51331967,
14.00410397, 11.69329897, 12.79394813, 11.18434343])The name of the player with less than 10,000 aces who has played the most matches in their career.
less_aces_players = tennis.where("Num. Aces", are.below("10000"))
less_aces_most_matches = less_aces_players.sort("Matches Played", descending=True).column("Name").item(0)
--------------------------------------------------------------------------- UFuncTypeError Traceback (most recent call last) Cell In[7], line 1 ----> 1 less_aces_players = tennis.where("Num. Aces", are.below("10000")) 2 less_aces_most_matches = less_aces_players.sort("Matches Played", descending=True).column("Name").item(0) File /opt/anaconda3/envs/quarto/lib/python3.13/site-packages/datascience/tables.py:1415, in Table.where(self, column_or_label, value_or_predicate, other) 1413 else: 1414 predicate = value_or_predicate -> 1415 column = [predicate(x) for x in column] 1416 return self.take(np.nonzero(column)[0]) File /opt/anaconda3/envs/quarto/lib/python3.13/site-packages/datascience/predicates.py:225, in _combinable.__call__(self, x) 224 def __call__(self, x): --> 225 return self.f(x) File /opt/anaconda3/envs/quarto/lib/python3.13/site-packages/datascience/predicates.py:121, in are.below.<locals>.<lambda>(x) 119 """Less than y.""" 120 check_iterable(y) --> 121 return _combinable(lambda x: x < y) UFuncTypeError: ufunc 'less' did not contain a loop with signature matching types (<class 'numpy.dtypes.Int64DType'>, <class 'numpy.dtypes.StrDType'>) -> None
The code errors because "10000" is a string, making comparisons with the values in the Num. Aces column (which are integers) invalid. Correct code:
less_aces_players = tennis.where("Num. Aces", are.below(10000))
less_aces_most_matches = less_aces_players.sort("Matches Played", descending=True).column("Name").item(0)
Note: If we wanted the code to evaluate to the actual name, we would need a new line to call less_aces_most_matches.
less_aces_most_matches'Pete Sampras'Data 8 staff love to answer questions on Ed! The table staff contains information about the staff’s Spring 2025 Data 8 Ed statistics. There are 5 columns:
string): name of the staff member.int): the ID of the staff member.float): the number of hearts awarded per post made by a staff member (0 if no posts made)int): number of answers to Ed questions and comments.boolean): whether or not the staff member was an admin of the Data 8 Spring 2025 Ed.Some rows are shown below:
from datascience import Table
import numpy as np

staff = Table().with_columns(
    "Name", [
        "Dagny Streit",
        "Dylan Tay",
        "Isaac Chung",
        "Mariel Del Rosario",
        "Brandon Su",
        "Marissa Lumpkin"
    ],
    "ID", [18, 7, 4, 8, 5, 0],
    "Hearts per Post", [6.5172, 0, 9.1333, 0, 0, 16],
    "Answers", [165, 102, 240, 82, 48, 22],
    "Admin", [True, False, True, False, True, True]
)

staff| Name | ID | Hearts per Post | Answers | Admin |
|---|---|---|---|---|
| Dagny Streit | 18 | 6.5172 | 165 | True |
| Dylan Tay | 7 | 0 | 102 | False |
| Isaac Chung | 4 | 9.1333 | 240 | True |
| Mariel Del Rosario | 8 | 0 | 82 | False |
| Brandon Su | 5 | 0 | 48 | True |
| Marissa Lumpkin | 0 | 16 | 22 | True |
For each of the columns in staff, identify if the data contained in that column is numerical or categorical.
One way of determining if a column is numerical or not is to perform arithmetic operations on its values. For example, do we get a meaningful result if we add two IDs together? If not, the column may be categorical.
staff.column("ID").item(0) + staff.column("ID").item(1) #This doesn't make sense!25Professor Sanchez wants to award a prize to a staff member based on their performance on Ed. To be eligible, the staff member must receive at least one heart per post and hold an admin role. Among those who meet these criteria, the staff member with the highest number of answers will be selected as the winner. Fill in the code blanks to determine who earns the prize.
good_staff = staff.where(_________________________).where(___________)
lucky_staff_name = ____________.sort(___________________).column(______).item(0)good_staff = staff.where("Hearts per Post", are.above_or_equal_to(1)).where("Admin", True)
lucky_staff_name = good_staff.sort("Answers", descending=True).column("Name").item(0)Note: If we wanted the code to evaluate to the actual name, we would need a new line to call lucky_staff_name.
lucky_staff_name'Isaac Chung'A table named seat contains a row for each time a student submitted the attendance form in lecture on September 18th, 20th, or 22nd. The table contains four columns.
(Fall 2017 Midterm Question 2 Modified)
seats = Table.read_table('seat.csv') # Initializing the seats table
seats.show(3)| Row | Seat | Date | |
|---|---|---|---|
| sulu@berkeley.edu | C | 102 | 20 |
| mccoy@berkeley.edu | A | 3 | 18 |
| kirk@berkeley.edu | R | 110 | 20 |
... (1747 rows omitted)
Fill in the blanks of the Python expressions to compute the described values. You must use all and only the lines provided. The last (or only) line of each answer should evaluate to the value described.
Sometimes it’s helpful to practice problems that feel like actual exam questions.
Key Lessons
Working through these types of problems now gives you a taste of what to expect on exams and builds confidence.
The largest seat number in the seat table.
Method 1:
max(____________________________________)
max(seats.column('Seat'))150Method 2:
___________.sort(_____________, _______________)._______________.________________
seats.sort('Seat', descending=True).column('Seat').item(0)150A common pattern in Data 8 is:
table.sort("column_name").column("column_name").item(0)This lets us find the row with the largest (or smallest) value in a column.
You’ll see this pattern repeatedly, so it’s worth getting comfortable with it now.
The total number of attendance submissions for September 20th in rows A, B, C, D, or E.
Hint: You can use Table.where predicates to compare letters lexicographically (e.g. A is below B). You could alternatively use a different method that does not involve comparing lexicographically.
filtered_seats = seats.__________(________________, __________________)
filtered_seats.__________(________________, ________________).______________filtered_seats = seats.where("Row", are.below("F"))
filtered_seats.where("Date", 20).num_rows106or
filtered_seats = seats.where("Row", are.contained_in(make_array("A", "B", "C", "D", "E")))
filtered_seats.where("Date", 20).num_rows106Ethan and his friends attend various concerts. The table concerts contains information about their adventures in 2022. There are four columns:
Some rows are shown below:
# Initializing the table
concerts = Table().with_columns(
    "Name", [
        "Jeffrey", "Kristen", "Ethan", "Jeffrey", "Oscar",
        "Maya", "Liam", "Sophia", "Noah", "Emma",
        "Ethan", "Ava", "Olivia", "Ethan", "Lucas"
    ],
    "Artist", [
        "Blackpink", "Seventeen", "BTS", "Twice", "BTS",
        "Blackpink", "Seventeen", "Twice", "BTS", "Blackpink",
        "Twice", "Seventeen", "BTS", "Twice", "Twice"
    ],
    "Month", [
        11, 8, 4, 5, 4,
        12, 7, 6, 9, 11,
        5, 8, 4, 5, 6
    ],
    "Price", [
        132.62, 42.68, 70.02, 392.11, 70.02,
        145.00, 50.00, 400.00, 75.00, 150.00,
        392.11, 48.50, 72.00, 400.00, 390.00
    ]
)

concerts.show(5)| Name | Artist | Month | Price |
|---|---|---|---|
| Jeffrey | Blackpink | 11 | 132.62 |
| Kristen | Seventeen | 8 | 42.68 |
| Ethan | BTS | 4 | 70.02 |
| Jeffrey | Twice | 5 | 392.11 |
| Oscar | BTS | 4 | 70.02 |
... (10 rows omitted)
For each of the columns in concerts, identify if the data contained in that column is numerical or categorical.
Not all numbers are numerical!
A good rule of thumb:
If adding or averaging the values doesn’t make sense, the data is categorical.
ZIP codes are a classic case: they look like numbers, but they are categorical.
You can group or compare them, but taking an average ZIP code isn’t meaningful.
Assume Ethan attended two Twice concerts in 2022. Assign months_passed to the number of months in between those two concerts as an integer.
ethan_twice_months = concerts.where(___________, ___________).where(___________, ___________).column('Month')
months_passed = abs(___________________________)Chaining .where() calls is the only way to filter a table by multiple conditions.
.where() returns a new table, so it can be followed by another .where().Being mindful of the data type that each method returns is crucial.
ethan_twice_months = concerts.where('Name', 'Ethan').where('Artist', 'Twice').column('Month')
months_passed = abs(ethan_twice_months.item(0) - ethan_twice_months.item(1))months_passed0