Code
from datascience import *
import numpy as np
%matplotlib inline| Name | Wesley Zheng |
| Pronouns | He/him/his |
| wzheng0302@berkeley.edu | |
| Discussion | Wednesdays, 12–2 PM @ Etcheverry 3105 |
| Office Hours | Tuesdays/Thursdays, 2–3 PM @ Warren Hall 101 |
Contact me by email at ease — I typically respond within a day or so!
Tiffany has a bag with three marbles. One marble is orange, and the other two are purple. For each round of a game, she draws from the bag 10 times with replacement. She wins the round by drawing at least one orange marble.
Write a function to simulate one round of Tiffany’s game. The function should return True if she wins and False if she loses.
from datascience import *
import numpy as np
%matplotlib inlinedef one_round():
bag = ____________________________________________________
one_sim = ________________________________________________
num_orange = _____________________________________________
return ___________________________________________________def one_round():
bag = make_array('purple', 'purple', 'orange')
one_sim = np.random.choice(bag, 10)
num_orange = sum(one_sim == 'orange')
return num_orange >= 1Instead of sum, students can also use np.count_nonzero(). They can also use sample_proportions with probabilities (\(\frac{2}{3}\), \(\frac{1}{3}\)).
one_round()TrueFinish the following code to help Tiffany simulate 100 rounds of the game and assign the variable win_proportion to the proportion of rounds she wins.
count = 0
for _____________________________________________:
  if ________________________________________________:
    ________________________________________________________
win_proportion = _______________________________________________count = 0
for i in np.arange(100):
if one_round():
count = count + 1
win_proportion = count / 100win_proportion0.98if one_round()” works by incrementing the count variable when one_round() evaluates to True (and will not if one_round() evaluates to False).
For any one draw, what is the probability that Tiffany draws a purple marble?
For any individual round, what is the probability that Tiffany loses?
Using the multiplication rule:
\(P(Tiffany\:loses\:one\:round) = P(draw\:10\:purples) = P(purple)^{10} = (\frac{2}{3})^{10}\)For any individual round, what is the probability that Tiffany wins?
Using the complement rule:
\(P(Tiffany\:wins\:one\:round) = 1 - P(Tiffany\:loses\:one\:round) = 1 - (\frac{2}{3})^{10}\)
Brandon is flipping a coin. He thinks it is unfair, but is not sure. He flips it 10 times and gets heads 9 times. He wants to determine whether the coin was actually unfair, or whether the coin was fair and his result of 9 heads in 10 flips was due to random chance.
What is a possible model that he can simulate under?
A possible model that you could simulate under is that on each flip, there is a 50% chance that the coin lands heads and a 50% chance that the coin lands tails. Any difference is due to chance.
If you are more familiar with probability: The heads are like independent and identically distributed draws at random from a distribution in which 50% are Heads and 50% are Tails.What is an alternative model for Brandon’s coin? You do not necessarily have to be able to simulate under this model.
What is a good test statistic that you could compute from the outcome of his flips? Calculate that statistic for your observed data. Hint: If the coin was unfair, it could either be biased towards heads or biased towards tails.
A good test statistic is the absolute difference between the number of heads we observe and the expected number of heads (5). Our observed test statistic is $\(9 - 5\)$ = 4. Notice that this statistic is large for both a large number of heads, as well as a small number of heads.
We could also use proportions as our test statistic, i.e., \(\vert\) proportion of heads - 0.5 \(\vert\).
Complete the function flip_ten, which takes no arguments and does the following:
def flip_ten():
  faces = make_array("Heads", "Tails")
  flips = ___________________________________________________________
  num_heads = _______________________________________________________
return ____________________________________________________________def flip_ten():
faces = make_array("Heads", "Tails")
flips = np.random.choice(faces, 10)
num_heads = np.count_nonzero(flips == "Heads")
return abs(num_heads - 5)flip_ten()1Complete the code below to simulate the experiment 10000 times and record the statistic computed in each of those trials in an array called simulated_stats.
trials = _____________________________________________________________
simulated_stats = ____________________________________________________
for _________________________________________:
  one_stat = ________________________________________
_______________ = _________________________trials = 10000
simulated_stats = make_array()
for i in np.arange(trials):
one_stat = flip_ten()
simulated_stats = np.append(simulated_stats, one_stat)simulated_statsarray([ 1., 1., 0., ..., 0., 1., 0.])Suppose we performed the simulation and plotted a histogram of simulated_stats. The histogram is shown below.
Table().with_columns('Absolute Differences', simulated_stats).hist("Absolute Differences", bins = np.arange(11))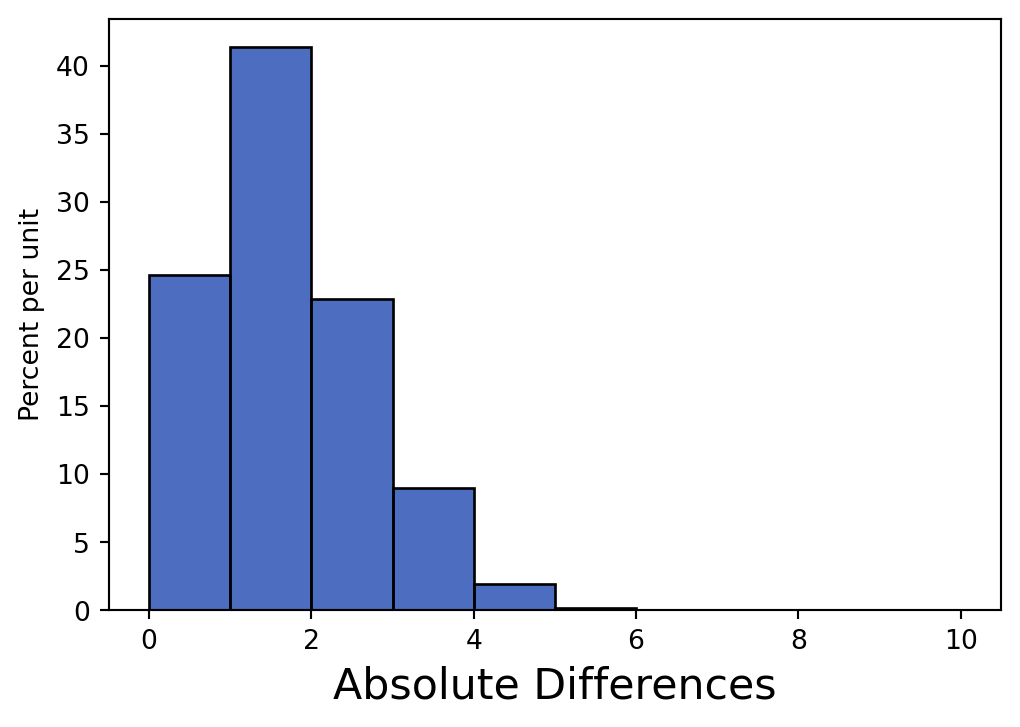
Is our observed statistic from (c) consistent with the model we simulated under?
(Spring 2017 Midterm Question 3)
A basket of 10 colored tickets contains 1 blue, 1 gold, 4 green, and 4 red tickets. If you draw 6 tickets uniformly at random with replacement, what is the chance that you draw at least one that is either blue or gold? Write your answer as a Python expression that computes the result exactly (no simulation).
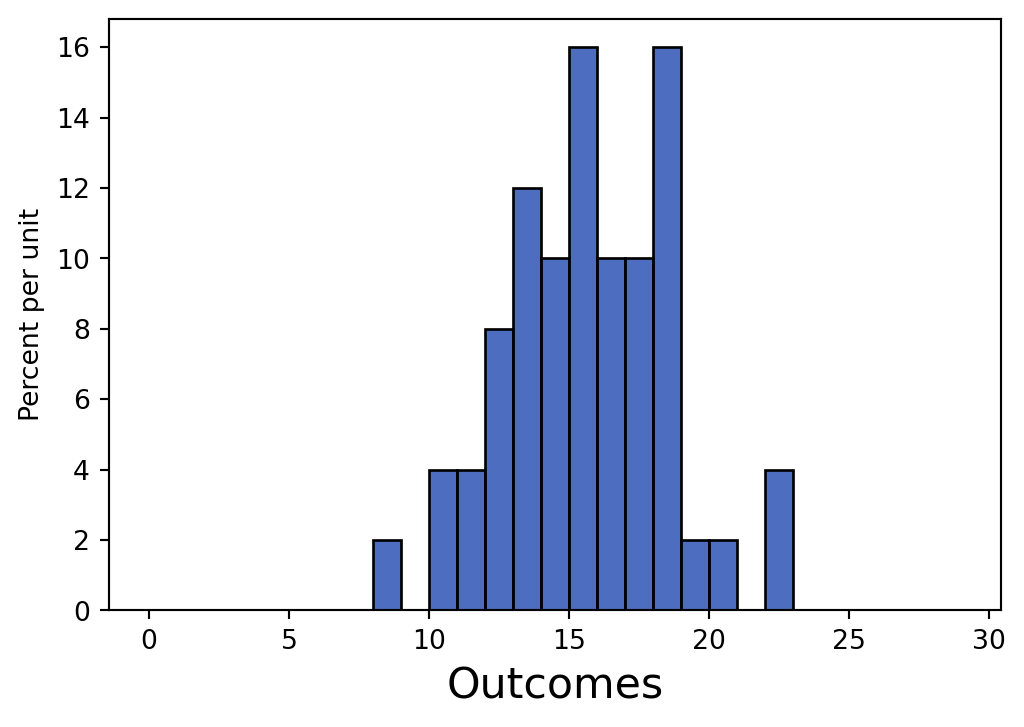
1 - 0.8 ** 60.7378559999999998The roll function draws an empirical histogram of the number of results that are \(k\) or larger, when \(n\) fair 6-sided dice are rolled. For example, if \(k\) = 5, \(n\) = 3, and rolling three dice results in the faces \(\{6, 4, 5\}\), then two of the three dice are 5 or larger (the 6 and the 5). Fill in the blanks to complete its implementation.
def roll(k, n, trials):
  """Repeatedly roll `n` dice `trials` times and check how many results are `k` or larger."""
  outcomes = make_array()
  possible_results = _______________________________________
  for i in _________________________________________________:
    rolls = _____________________________________________________
    outcomes = __________________________________________________
Table().with_column("Outcomes", outcomes).hist(bins=np.arange(30))def roll(k, n, trials):
"""Repeatedly roll n dice and check how many results are k or larger."""
outcomes = make_array()
possible_results = np.arange(1, 7)
for i in np.arange(trials):
rolls = np.random.choice(possible_results, n)
outcomes = np.append(outcomes, np.count_nonzero(rolls >= k))
Table().with_column('Outcomes', outcomes).hist(bins = np.arange(30))roll(5, 30, 1000)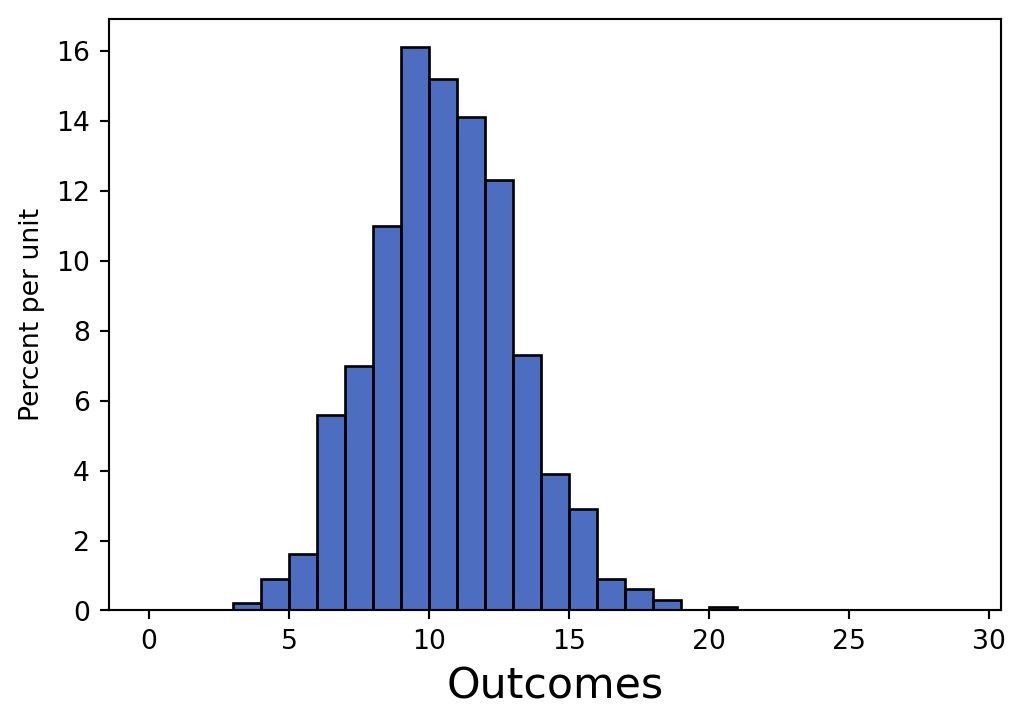
Assume roll is implemented correctly for the below questions.
roll(6, 30, 5000)
roll(4, 30, 50)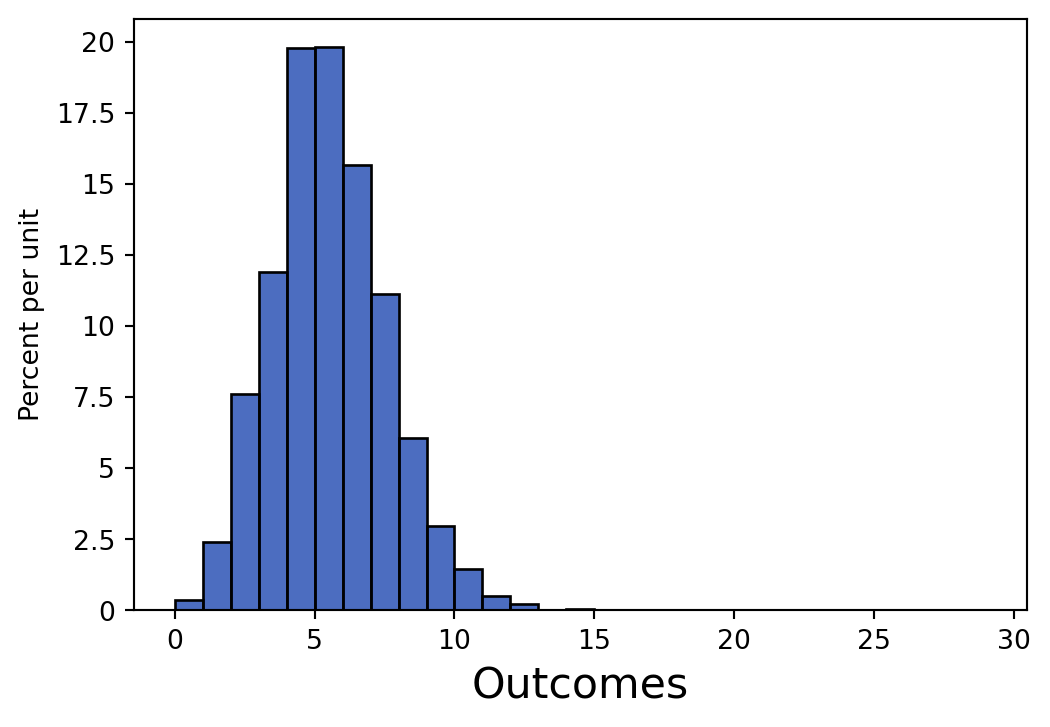
Which expression generates the first histogram?
Which expression generates the second histogram?